
Operation Broken Fang launches — how CS2 skin prices reacted
2020-12-03
2020-12-03: Operation Broken Fang launches. Tracked CS2 items moved -13.1% (median) the next day, -13.6% in 7 days and +6.9% in 30 days; moves by group and the biggest risers and fallers.
Timeline
- Operation Broken Fang launches source
How the market moved
| Category | 7 days before | 1 day after | 7 days after | 30 days after |
|---|---|---|---|---|
| All tracked items | -1.7% (155) | -13.1% (155) | -13.6% (155) | +6.9% (155) |
| Agent | -2.6% | -31.6% | -32.5% | -27.8% |
| Container | -1.8% | -12.6% | -19.2% | +12.6% |
| Other | -11.0% | -10.5% | -6.4% | +9.8% |
| Pistol | -3.1% | -13.3% | -8.1% | +9.4% |
| Rifle | -1.2% | -15.8% | -10.0% | +6.9% |
| SMG | -1.3% | -12.9% | -13.4% | +5.7% |
| Sticker | +0.8% | -9.3% | -18.5% | -2.5% |
| Sticker capsule | -2.9% | -6.3% | -15.7% | +2.5% |
Moves are the median change of the tracked items' Steam daily median sale prices (items priced on both days; their number in brackets), counted from the day before the news.
Biggest moves in the 7 days after
Biggest risers
| Item | Change | Sold in the window |
|---|---|---|
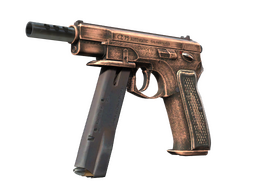 CZ75-Auto | Distressed (Factory New) CZ75-Auto | Distressed (Factory New) | +69.4% | 483 |
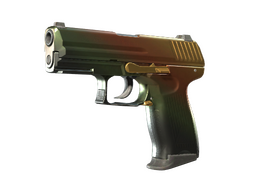 P2000 | Amber Fade (Factory New) P2000 | Amber Fade (Factory New) | +22.3% | 2,038 |
 Sticker | Basilisk Sticker | Basilisk | +17.8% | 366 |
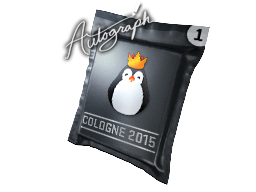 Autograph Capsule | Team Kinguin | Cologne 2015 Autograph Capsule | Team Kinguin | Cologne 2015 | +8.7% | 59 |
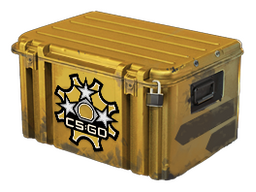 Revolver Case Revolver Case | +7.5% | 155,670 |
Biggest fallers
| Item | Change | Sold in the window |
|---|---|---|
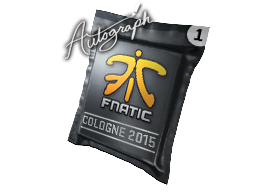 Autograph Capsule | Fnatic | Cologne 2015 Autograph Capsule | Fnatic | Cologne 2015 | -38.8% | 126 |
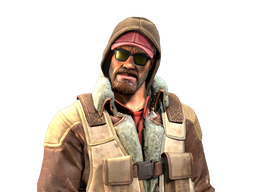 Dragomir | Sabre Dragomir | Sabre | -37.2% | 8,104 |
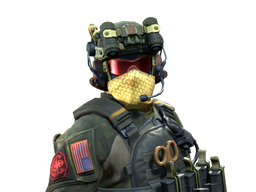 Seal Team 6 Soldier | NSWC SEAL Seal Team 6 Soldier | NSWC SEAL | -35.4% | 8,164 |
 Blackwolf | Sabre Blackwolf | Sabre | -33.7% | 9,151 |
 The Elite Mr. Muhlik | Elite Crew The Elite Mr. Muhlik | Elite Crew | -33.2% | 7,593 |
This page states market data only; it is not investment advice.